

Customer Shopping Behavior and Revenue Analysis
A customer analytics case study exploring revenue concentration, subscription behavior, product performance, and segment-level spending patterns.
This project analyzes how a retail company’s customers actually spend their money, and separates the patterns that are real from the ones that only look real on the surface.
Business Problem
Retailers collect enormous volumes of transaction data — every purchase, discount, subscription, and shipping choice — but rarely have time to look past the surface-level numbers. Simple metrics like “which gender generates more revenue” or “do subscribers spend more” can be misleading on their own, since they often reflect differences in customer count or segment size rather than actual differences in buying behavior. Without deeper analysis, a business risks drawing the wrong conclusions from its own data and prioritizing the wrong customer segments, products, or channels.
Analytical Objective
Analyze customer transaction data to uncover the real drivers of revenue and spending behavior — separating genuine patterns from statistical artifacts — and identify which customer segments, products, and channels offer the clearest opportunities for growth.
Highlight
Found that male customers appear to generate over twice the revenue of female customers — but that gap almost entirely disappears once customer count is accounted for, with average spend per customer nearly identical between genders. Also identified that subscription status has no meaningful relationship to spend, meaning the business’s real growth lever is repeat-purchase frequency, not subscription enrollment.
Data Context
- Customer transaction data covering demographics (gender, age group), product details (category, item purchased, review rating), and purchase behavior (subscription status, discount usage, shipping type, previous purchase count)
- Retail/e-commerce transaction records spanning a single dataset snapshot rather than a rolling time series
- Final analyzed dataset: 3,900 customers across 4 product categories and 25 individual items
Method and tools
- exploratory data analysis
- customer segmentation
- dashboard storytelling
- Python (Pandas, NumPy, Plotly)
- SQL
- Power BI
Workflow
- cleaned and transformed customer transaction data
- explored product, demographic, and subscription-level patterns
- queried transactional data using SQL
- segmented customers by activity and value behavior
- built visual dashboards to compare revenue, retention, and segment performance
- translated results into business recommendations
Analytical Approach
Customer Shopping Behavior (3,900 Customers)

Subscription Impact on Revenue
Non-subscribers currently account for the majority of total revenue, primarily due to their larger share of the customer base. Subscription customers do not show higher average spend in this summary, so the business value of subscription should be evaluated through retention, purchase frequency, and lifetime value metrics rather than revenue totals alone.
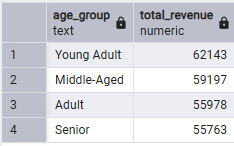
Age Group Revenue Contribution
Revenue distribution across age groups reveals distinct differences in customer value by demographic segment. Identifying the highest-contributing groups enables more focused resource allocation, tailored marketing strategies, and product alignment to maximize revenue from the most impactful customer segments.
Figure 1 shows Top 10 Items by Revenue. This chart identifies the highest-performing individual items based on revenue contribution. It provides a more detailed product-level view beyond category analysis and helps uncover which items are driving the strongest financial results. This type of insight can support pricing decisions, assortment strategy, and promotional planning.
Figure 2 shows Revenue by Product Category. This chart highlights how revenue is distributed across product categories, making it easier to identify which segments contribute the most commercial value. The analysis shows where customer spending is concentrated and helps reveal which categories may deserve stronger marketing focus, deeper inventory planning, or more strategic business attention.
Figure 3 shows Revenue by Age Group. This chart shows how revenue is generated across different age groups, revealing which customer segments contribute the greatest monetary value. It helps identify high-value demographics and supports more focused targeting strategies, allowing the business to align promotions, product messaging, or campaigns with the customer groups driving the most revenue.
Figure 4 shows Customer Share by Subscription Status. This chart shows the distribution of customers based on subscription status, helping assess customer mix and engagement structure. It gives a quick view of how much of the customer base is subscribed versus non-subscribed, which can support loyalty analysis and help evaluate whether subscription-based engagement may represent an opportunity for stronger retention or targeted campaigns.
Figure 5 shows Average Purchase Amount by Shipping Type. This chart compares average purchase amount across shipping methods to uncover whether certain fulfillment preferences are associated with higher-value orders. It provides insight into how customer convenience choices may relate to spending behavior and can help businesses refine shipping offers, delivery strategies, or checkout optimization.
Figure 6 shows a Pareto Analysis of Revenue by Item Purchased. Items are ranked by total revenue and plotted against their cumulative share of revenue, testing whether the 80/20 rule holds at the item level. This dataset does not follow the 80/20 rule — revenue is spread almost evenly across the 25 items in the catalog: the top 20% of items (5 items) generate only about 22% of revenue, and it takes 80% of the catalog (20 of 25 items) to reach 80% of revenue. A “focus on the top few SKUs” strategy isn’t supported by this data; demand is broad-based, so category-level (not SKU-level) prioritization is the more defensible lever.
Key Findings
- Revenue was concentrated in selected customer segments rather than evenly distributed across the customer base.
- Subscription status alone does not predict higher spend; retention and repeat-purchase frequency are better indicators of long-term customer value than subscription status.
- A limited number of product categories and top-performing items generated the strongest commercial impact.
- Shipping behavior showed measurable differences in average basket size.
- The clearest growth opportunities appear in high-value segments, subscription-oriented customers, and top-performing product groups.
Business Recommendations
- Focus retention strategies on high-value and repeat-purchase customer segments.
- Strengthen subscription-based engagement for customers with frequent purchase behavior.
- Prioritize top-performing categories and products in marketing and assortment planning.
- Use segment-based campaigns instead of one broad message for all customers.
- Consider shipping and fulfillment as part of the revenue optimization strategy.
Why This Matters
This project shows how customer transaction data can be turned into actionable revenue insight. It helps identify where value is concentrated, which customer groups matter most, and where more targeted growth strategies may be most effective.
What This Project Demonstrates
- customer segmentation analysis
- revenue driver identification
- behavior-based interpretation
- dashboard storytelling
- ability to translate raw data into business recommendations
Conclusion
This project demonstrates how customer analytics can turn raw transactional data into meaningful business insight. By combining segmentation, spending analysis, and dashboard storytelling, the work highlights how customer behavior can support stronger targeting, retention, and revenue growth.