
Procurement Spend Analytics
and Vendor Risk Analysis
A procurement analytics case study using MySQL and Power BI to identify vendor spend concentration, discount performance, and renegotiation opportunities.
This project analyzes how much money a company pays its outside suppliers (“vendors”), and flags which supplier relationships are worth renegotiating.
Business Problem
Companies rely on many outside suppliers, known as vendors, to run day-to-day operations. Most companies rarely examine this spending closely. As a result, it becomes difficult to tell which supplier relationships are working well and which ones need to change.
Analytical Objective
Build a system that tracks vendor spending and identifies which supplier relationships are worth renegotiating.
Highlight
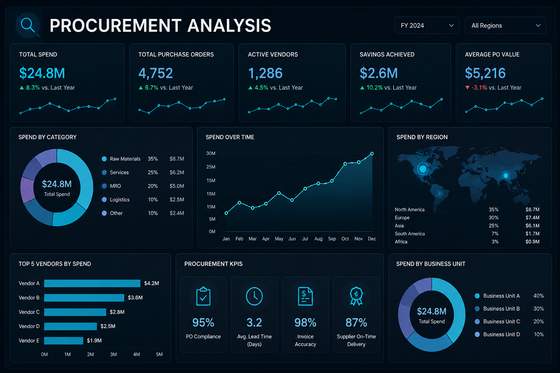
Built a dashboard that automatically identifies vendors who receive significant spending but offer limited discounts in return. Also found that spending is distributed across nearly all vendors rather than concentrated among a few — contrary to what most would expect.
Data Context
- Procurement transaction data modeled on an 8-table relational schema (Vendor, Item, Location, Date, Currency, Exchange Rate, Invoice, Invoice Line Item)
- 2 years of daily transaction data
- Final cleaned dataset: 3,259 invoices, 9,776 invoice line items, 30 vendors
Analytical Approach
Method and Tools
- Relational database design (star schema)
- SQL: CTEs, window functions (RANK, LAG, SUM OVER), subqueries
- Data cleaning and referential integrity validation
- Power BI dashboard design and DAX measures
- Interactive Plotly visualizations
MySQL 8 · Power BI · Python (data generation, validation, and charting)
Workflow
- Designed a star-schema database (1 fact table, 5 dimension tables) in MySQL
- Loaded and validated the dataset, checking for nulls, duplicate keys, broken foreign key references, and statistical outliers
- Wrote 11 analytical SQL queries using CTEs, window functions (RANK, LAG, running SUM OVER), and subqueries to answer spend, discount, concentration, and Pareto questions
- Built a Power BI dashboard connecting directly to MySQL, with DAX measures for total spend, savings, discount rate, and an automated vendor renegotiation flag
- Built supplementary interactive Plotly visualizations for deeper exploration of each finding
- Translated the analysis into a prioritized, actionable vendor list
Figure 1: Total procurement spend broken down by vendor tier. Tier 1 accounts for $32.05M (38.1%) and Tier 2 for $31.80M (37.8%), nearly identical shares, while Tier 3 trails at $20.21M (24.0%).
Figure 2: Monthly spend across the full 2024–2025 period. A consistent seasonal dip appears every September in both years, with spend recovering sharply by November and December.
Figure 3: The ten highest-spend vendors, ranging from Vantage IT Services at $3.88M down to Falcon Warehousing at $2.92M, together accounting for just under 40% of total spend.
Figure 4: Total spend across the four procurement categories, led by Indirect Goods & Services at $27.03M, with Direct materials the smallest at $14.40M.
Figure 5: All 30 vendors ranked by spend against their cumulative share of total spend. The 80% threshold isn’t reached until vendor #23 — a notably flat concentration curve rather than a classic 80/20 pattern.
Figure 6: Every vendor plotted by average discount rate against total spend. Vendors in the upper-left quadrant — above-average spend paired with below-average discount — are flagged as renegotiation candidates.
Business Recommendations
● Prioritize conversations with the identified vendors first, as they represent the clearest opportunity.
● Consider consolidating spend among fewer vendors to strengthen negotiating power.
● Plan ahead for the seasonal slowdown in September rather than reacting to it.
● Review vendor tiers regularly to identify emerging risks early.
● Repeat this analysis quarterly rather than treating it as a one-time exercise.
Why This Matters
Most companies already possess this data, yet rarely take the time to analyze it. This project transforms unused data into three practical outcomes for a procurement team: a clear list of vendors worth renegotiating, evidence that consolidating vendors could reduce costs, and a dashboard that updates automatically as new data arrives.
What This Project Demonstrates
- Relational database design (star schema) from raw transactional data
- SQL proficiency: CTEs, window functions, subqueries, referential integrity validation
- Power BI dashboard design connected to a live SQL data source
- DAX measure design, including multi-condition automated flagging logic
- Interactive data visualization with Plotly
- Ability to translate a broad analytical question into a specific, actionable business output
Conclusion
This project converts everyday purchase records into a tool a procurement team could genuinely use. It identifies exactly which vendors are worth renegotiating with, and reveals that the company works with more vendors than necessary. This is not simply a report; it is a repeatable system that continues to deliver value well beyond the initial analysis.
Real-World Impact & Benefit
The true value of this project lies in what it allows a business to do differently, not just what it reveals.
● It turns unused invoice data into direct, actionable savings. Rather than guessing which vendor to renegotiate with, a procurement team can open the dashboard and see exactly who to approach first.
● It exposes a hidden risk. Before this analysis, the business would likely assume its top vendors were already well-negotiated simply because they receive the most attention. The data shows otherwise — visible only once spend and discount are examined together.
● It reveals a genuine cost-saving opportunity through consolidation. Because spending is spread across far more vendors than expected, routing more volume through fewer suppliers could meaningfully increase the company’s negotiating leverage.
● It supports better planning. Knowing that invoice activity consistently drops every September allows procurement to plan negotiations and staffing around a real, recurring pattern instead of reacting to it after the fact.
● It becomes a living system, not a one-time report. Because it connects directly to the underlying data, the same dashboard can be refreshed every quarter — meaning the business benefits from this work continuously, not just once.